Briefing
ChartNav's monitor flagged this zone automatically: an average of 361 vessels present over the last 24 hours against a 87-day median of 519 (-30%). This zone's day-to-day swing is normally about 5%. Cause unknown — this is a data signal, not a news report; the live map and manifest below show what is actually moving.
20
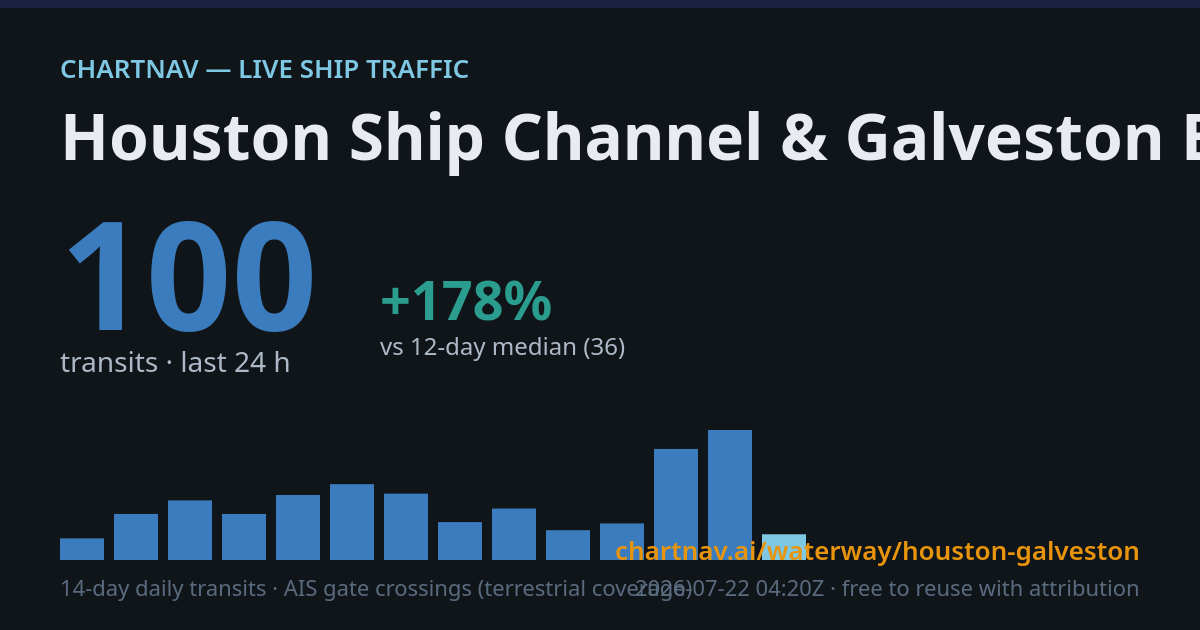
Transits (24 h)
-51%
vs 29-day median
—
Vessels in zone
—
Underway now
Data & citation
Transit counts are gate-line crossings computed hourly from ChartNav's own live AIS network (terrestrial receivers; coverage varies by zone — the coverage figure above says how complete the picture is, and reporting gaps are only flagged for vessels that were underway and stopped reporting globally). Baselines are rolling medians of complete days. Numbers may differ from weekly satellite-AIS datasets such as IMF PortWatch, which lag by several days but see areas terrestrial receivers cannot.
Reuse is welcome with attribution and a link. Feed: RSS · Download: daily metrics CSV · Share card: auto-updating PNG · Embed: <iframe src="https://chartnav.ai/embed/zone/houston-galveston" width="600" height="400"></iframe> · Cite: chartnav.ai/waterway/houston-galveston
Reuse is welcome with attribution and a link. Feed: RSS · Download: daily metrics CSV · Share card: auto-updating PNG · Embed: <iframe src="https://chartnav.ai/embed/zone/houston-galveston" width="600" height="400"></iframe> · Cite: chartnav.ai/waterway/houston-galveston