Briefing
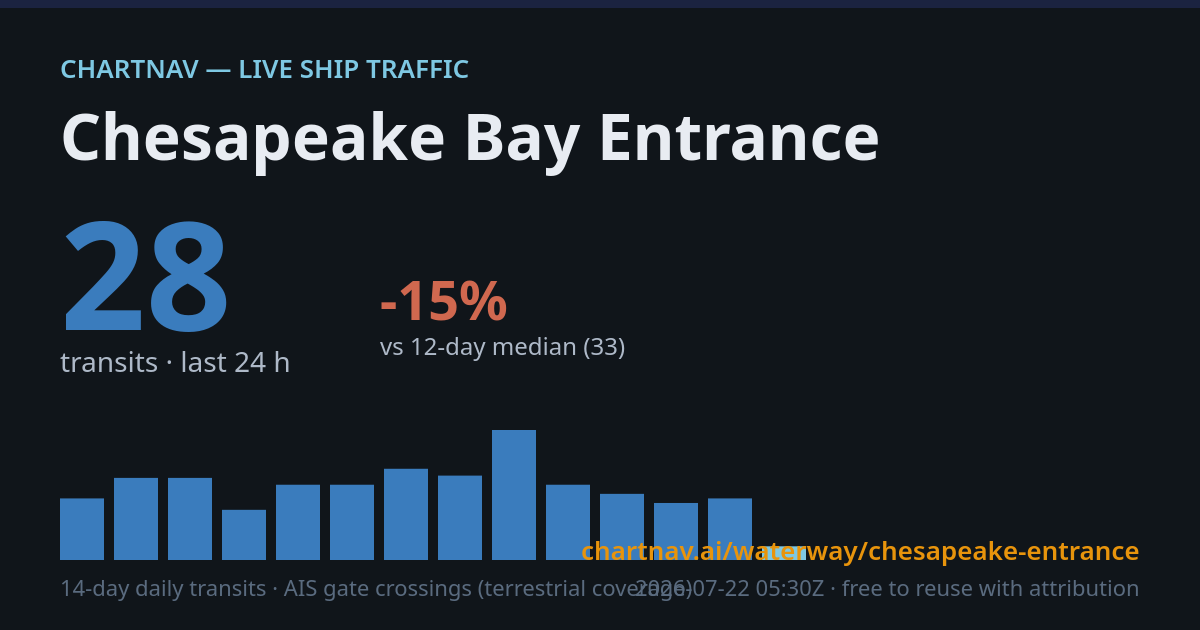
Chesapeake Bay Entrance traffic has dropped sharply to 16 transits in the past 24 hours, representing a 48 percent decline from the 87-day median of 31 transits, per ChartNav's monitor. This marks a continuation of an anomaly that began on July 25, with several alerts tracking swings between -66 and +62 percent since late September. Normal daily variation in this zone runs approximately six transits. AIS coverage stands at 0.98, providing reliable data. The cause remains unknown; this reflects a traffic pattern shift detected through ChartNav's automated monitoring rather than reported operational disruptions. Actual vessel movements visible on the live map and manifest may provide additional context.
26
Transits (24 h)
+13%
vs 30-day median
—
Vessels in zone
—
Underway now
Data & citation
Transit counts are gate-line crossings computed hourly from ChartNav's own live AIS network (terrestrial receivers; coverage varies by zone — the coverage figure above says how complete the picture is, and reporting gaps are only flagged for vessels that were underway and stopped reporting globally). Baselines are rolling medians of complete days. Numbers may differ from weekly satellite-AIS datasets such as IMF PortWatch, which lag by several days but see areas terrestrial receivers cannot.
Reuse is welcome with attribution and a link. Feed: RSS · Download: daily metrics CSV · Share card: auto-updating PNG · Embed: <iframe src="https://chartnav.ai/embed/zone/chesapeake-entrance" width="600" height="400"></iframe> · Cite: chartnav.ai/waterway/chesapeake-entrance
Reuse is welcome with attribution and a link. Feed: RSS · Download: daily metrics CSV · Share card: auto-updating PNG · Embed: <iframe src="https://chartnav.ai/embed/zone/chesapeake-entrance" width="600" height="400"></iframe> · Cite: chartnav.ai/waterway/chesapeake-entrance